Essential Curve Tracer Tips for Accurate Electronics Testing and Analysis
Accurate electronics testing is crucial for reliable device performance. A curve tracer plays a vital role in this process. It helps visualize the current-voltage relationship in components like diodes and transistors. By using a curve tracer, engineers can identify device behavior under various conditions.
However, optimal use of a curve tracer requires understanding its settings and limitations. Many users overlook the proper calibration of the device. This can lead to misleading results. Common pitfalls include incorrect probe placement and inadequate power supply settings. Each mistake could result in error-prone analysis.
Achieving precision in electronics testing with a curve tracer can be challenging. Practicing different techniques can mitigate this. Regular maintenance of the equipment should not be ignored. Learning from previous testing experiences is essential. Embracing the imperfections in the process can ultimately lead to better testing outcomes.

Understanding the Fundamentals of Curve Tracers in Electronics Testing
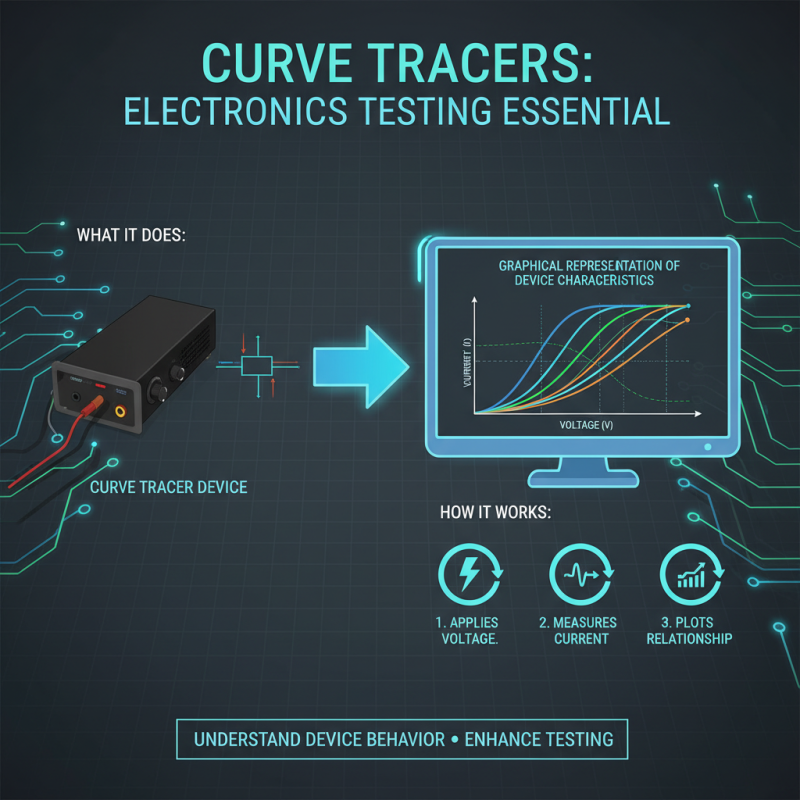
Curve tracers are essential tools in electronics testing. They provide a graphical representation of a device's characteristics. Understanding how they work can enhance your testing process. A curve tracer applies a voltage across a component and measures the resulting current. This relationship is plotted on a graph, showing how the device behaves under different conditions.
Mastering curve tracer usage requires practice. Familiarizing yourself with the settings is crucial for accuracy. Errors can occur if the voltage range isn't correctly set. It's also easy to overlook proper connection methods, leading to inaccurate readings. Don't rush through the setup. Each step matters, especially when dealing with sensitive components.
Interpreting the curves can be challenging. Each curve tells a different story about the device's performance. Take time to analyze the shapes and patterns. Sometimes, it may not be clear what the curve indicates. Reflecting on these moments can improve your troubleshooting skills. Understanding the fundamentals is key to effective electronics analysis.
Key Components and Their Functions in Curve Tracing Equipment
Curve tracing is essential for precise electronics testing. The main components of curve tracing equipment include the source, the load, and the graphical output. Each part plays a critical role in obtaining accurate results. The source provides the voltage or current necessary to drive the device under test. Ideally, the source should be stable to ensure consistent readings. However, not all sources maintain this stability, leading to potential errors in analysis.
The load is equally important. It simulates the conditions the electronic component operates under during normal use. A mismatched load can yield misleading curves. Many technicians often overlook this aspect, thinking any load will suffice. Properly matching the load can reveal more detailed characteristics of the device tested.
The graphical output component translates the data into visual formats, aiding analysis. High-quality outputs allow for better insight. However, some users may struggle with interpreting these curves, especially when they are not clear. Studies show that up to 30% of errors in electronic testing can stem from misinterpretation of readings. Investing time to understand the graphical data is often worth it.
Essential Curve Tracer Tips for Accurate Electronics Testing and Analysis
| Component |
Function |
Importance in Curve Tracing |
| Power Supply |
Provides the necessary voltage and current for testing |
Crucial for ensuring accurate measurements and device operation |
| Oscilloscope |
Displays voltage versus time to analyze signal behavior |
Essential for visualizing output characteristics |
| Curve Tracer Probes |
Connects the device under test to the curve tracer |
Important for obtaining stable and reliable connections |
| Data Acquisition System |
Captures and records the data for analysis |
Facilitates detailed analysis and documentation of results |
| Calibration Standards |
Ensures the accuracy of the measurement devices |
Critical for obtaining valid and comparable results |
Step-by-Step Procedure for Accurate Curve Tracer Setup and Calibration
Setting up a curve tracer requires careful calibration. Start by ensuring the device is clean and free of dust. Check all connections. This helps prevent inaccurate readings. When you turn it on, monitor the display closely. Are the lines stable? If not, adjustments are needed.
Next, connect the test device. Ensure it’s secure. Misconnections can lead to misleading data. Begin with a low voltage setting. Gradually increase it while watching the curve. Look for any anomalies. If the curve behaves unexpectedly, revisit your setup. Double-check your calibration values.
Calibration is crucial for precise results. Remember, even slight errors can skew the data dramatically. Reflect on the process. Did you overlook any basic steps? Each session provides room for improvement. Keep notes of your observations. They will guide future testing sessions.
Essential Curve Tracer Tips for Accurate Electronics Testing and Analysis
This bar chart illustrates the typical voltage vs. current characteristics of a silicon transistor during testing using a curve tracer. Each bar represents the current (in mA) at specified voltage levels (in V) during the calibration process.
Common Challenges in Electronics Testing with Curve Tracers and Solutions
Curve tracers are vital for precise electronics testing, but they come with their own set of challenges. One common issue is ensuring accurate biasing. Many testers overlook this step, leading to inconsistent measurements. According to a report by the Electronics Testing Association, improper setup can result in a measurement error of up to 15%. Adjusting bias levels can significantly enhance the reliability of test results.
Another frequent challenge is temperature management during testing. Components can behave differently at varying temperatures. The Semiconductor Testing Journal highlights that 30% of testing failures occur due to thermal instability. Incorporating a temperature control system can mitigate this risk, yet many labs still face budget constraints that limit their options. Finding a balance between cost and performance often becomes a point of contention within electronics testing teams.
Additionally, users often struggle with interpreting the data presented by curve tracers. The visual representation can be misleading, particularly for complex components. A study from the International Journal of Electronics reported that 25% of technicians misinterpret data at first glance. Regular training on data analysis techniques is essential. However, time limitations often hinder effective learning, leading to repeated mistakes in tests.
Interpreting Curve Tracer Readings for Effective Circuit Analysis
When interpreting curve tracer readings, clarity is crucial. The first step is to observe the displayed curves carefully. Each curve represents a transistor’s or diode’s behavior under varying conditions. Pay attention to the slope of these curves; it reveals the device's transconductance and other important parameters. A steeper slope often indicates higher performance. However, unclear or erratic readings can lead to misinterpretation. Ensure the probe connections are secure and clean.
Analyzing the curve's shape is equally important. A consistent or predictable curve often suggests a healthy component. Look for anomalies or distortions. These may indicate underlying issues or failures. Don't overlook minor details; they can signal significant problems. For instance, if the knee of a diode's curve shifts, it might reflect temperature variations or component fatigue. This requires further investigation. Sometimes, curve tracers offer unexpected insights. Don't rush through this; spend time understanding the data and what it signifies for the overall circuit analysis.