How to Choose an IV Curve Tracer in 2026?
Choosing an iv curve tracer in 2026 starts with the measurements you actually need, not the longest feature list. A rooftop installer checking module faults may value portability and quick field setup. A laboratory comparing cell performance may need tighter measurement control, repeatable sweeps, and detailed data export. These are different jobs. One instrument rarely serves both equally well.
Before comparing models, define the devices and conditions you expect to test. Check the tracer’s voltage and current ranges against your modules, strings, or components, with suitable headroom. Then consider sweep speed, measurement accuracy, temperature sensing, software compatibility, and how results can be stored or shared. A bright outdoor display and sturdy leads matter, too. Small details matter.
Specifications deserve careful reading. A published accuracy figure may depend on test conditions, accessories, or calibration status, so verify the manufacturer’s documentation rather than relying on a headline number. Ask how the instrument handles shading, changing irradiance, and repeated measurements. Not always obvious. Also check what is included: probes, adapters, protective equipment, and software licenses can change the real cost.
This guide explains how to match an iv curve tracer to your application, compare essential capabilities, and judge practical ownership costs. It also points out trade-offs that are easy to miss when shopping online. A neat specification sheet can still hide a frustrating mismatch. Your test environment, workflow, and support needs should shape the final choice.
Define the Test Basis: IEC 60904-1 and STC at 1,000 W/m², 25°C
Choosing an IV curve tracer starts with a clear test basis. IEC 60904-1 describes procedures for measuring photovoltaic device current-voltage characteristics. For an STC comparison, set irradiance to 1,000 W/m² and cell temperature to 25°C. The reference spectrum also matters. A number on the display means little if the test conditions are unclear.
Check how the tracer measures and records those conditions. It should work with a calibrated irradiance reference and a reliable cell-temperature sensor. Ambient temperature is not a substitute for cell temperature; a module in sunlight can heat well above the surrounding air. Small details matter. Confirm the instrument’s voltage and current ranges fit the array, and review measurement uncertainty, sweep time, and data export. A fast sweep is useful, but not if it misses unstable readings.
For outdoor work, sunlight and module temperature can change during a test. Record both alongside each curve, and avoid comparing results taken under different conditions without suitable corrections. I still double-check sensor placement: a shaded or poorly attached temperature probe can undermine an otherwise careful measurement. Not glamorous, but important. A practical tracer makes the test basis visible, repeatable, and easy to review later.
Match Voltage and Current Ranges to Module and Array Ratings up to 1,500 V DC
How to Choose an IV Curve Tracer in 2026?
Match Voltage and Current Ranges to Module and Array Ratings up to 1,500 V DC
Choose a tracer by the highest voltage and current it may encounter—not just a module’s nameplate values. For voltage, calculate the array’s open-circuit voltage at the site’s lowest expected temperature; cold modules can exceed their rated Voc. For current, consider short-circuit current and the number of parallel strings measured together. IEC 60904-1:2020 describes procedures for measuring photovoltaic current-voltage characteristics, but the field setup still determines whether readings are representative. IEA PVPS estimated 553–601 GW of new PV capacity was installed worldwide in 2024, underscoring the diversity of systems technicians now encounter.
Tips: For a system rated up to 1,500 V DC, confirm the tracer’s maximum input voltage exceeds the calculated cold-weather Voc. Check current limits, connector ratings, and whether the instrument measures one string or a combined array. Leave practical headroom; operating at the instrument’s ceiling can clip data. Follow the equipment manual and site procedures.
A common oversight is treating “1,500 V” as a complete specification. It describes a voltage ceiling, not the current range or measurement configuration. Compare the tracer’s limits with module data sheets, array layout, and expected conditions. The trade-off is not always neat: a wide-range instrument may lose resolution at low currents. Record the chosen test point and conditions, too; a curve without context can mislead.
Compare Sweep Speed and Sampling for Reliable Field I–V Curves
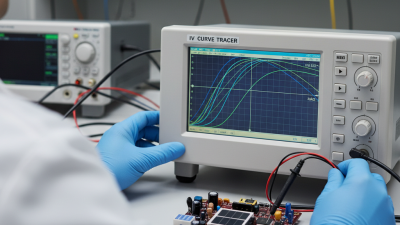
A useful IV curve tracer must capture the shape of a module’s response, not just produce a fast result. Sweep speed matters in the field, where passing clouds can change irradiance during a measurement. A rapid sweep reduces that window, but speed alone is not proof of accuracy. If the instrument samples too sparsely, it may miss a knee or a small step in the curve.
Check how many points are recorded across the voltage range and whether sampling remains consistent during a fast sweep. For a shaded array, closely spaced points can reveal multiple power peaks that a coarse trace smooths over. Timing matters, too. Compare the sweep duration with the conditions at the site, and note irradiance and module temperature alongside each trace. A curve without context can look precise while telling an incomplete story.
In practice, choose a balance: fast enough to limit changing-light effects, with enough samples to resolve meaningful curve features. Repeat a measurement when clouds cross or readings shift unexpectedly. A little delay. It can save a bad comparison.
I would not treat one impressive-looking trace as definitive; probe contact, temperature drift, and uneven illumination can still distort results. The best choice is the one whose speed and sampling fit the array and the conditions you actually measure.
Assess Safety and Data Reporting Against IEC 61724-1 Monitoring Requirements
How to Choose an IV Curve Tracer in 2026?
A curve tracer should capture more than a neat I-V curve. IEC 61724-1 defines monitoring classes and expectations for measurement quality, data handling, and system monitoring. Use it as a reporting benchmark, not proof that a tracer is IEC-certified. Check whether records include timestamp, irradiance, module temperature, sensor details, and measurement uncertainty. These let technicians compare Isc, Voc, Pmax, and fill factor against operating conditions. Small omissions matter.
Safety deserves equal weight. Match the instrument’s voltage and current limits to the array, and inspect lead insulation, connectors, and enclosure interlocks. Confirm the stated measurement category and follow the manufacturer’s isolation and discharge procedures. PV strings can retain hazardous DC voltage. Never rely on a screen warning alone.
IRENA’s Renewable Capacity Statistics 2024 reports 346 GW of solar capacity added worldwide in 2023. That expanding fleet makes comparable field data increasingly useful for troubleshooting and performance checks. Look for exportable files with clear units, stable timestamps, and traceable calibration records. A spreadsheet can still look tidy while hiding a drifting irradiance sensor. I would not treat one clean curve as proof; repeat measurements under documented conditions and review odd results before accepting them.